
Every Geographer knows the moment a Geobeers conversation takes a sharp turn into map projections. Usually, it starts with someone discovering the Mercator projection distorts the size of Greenland, and suddenly everyone is debating the merits of Gall-Peters, Winkel tripel, or Robinson. And you know I will always defend Mercator as the misunderstood kicking boy for the progressive cartographers of the “Organisation of Cartographers for Social Equality” 😉
While the debate over “fair” area representation is well-trodden ground, we are missing a much more urgent cartographic blind spot. In a world defined by renewed geopolitical tension, hypersonic missiles, Arctic shipping lanes, and global supply chains, our default mental map of the world—still largely anchored by the rectangular, equatorial-centric Mercator view—does a terrible job of showing proximity.
To understand modern geopolitics, we need to stop looking at the world from the equator and start looking at it from the poles.
The Right Tool for a Bygone Era
The first rule of map projections is of course simple: there is no such thing as a perfect map projection. Flattening a three-dimensional sphere onto a two-dimensional screen or sheet of paper inevitably forces a compromise. You can preserve shape, area, distance, or direction, but never all four at once. Every projection is an engineering choice designed for a specific practical application.
Gerardus Mercator’s 1569 projection was a masterpiece of functional design. By rendering lines of constant compass bearing (rhumb lines) as straight lines, it solved the most pressing spatial problem of the Age of Sail. It was built for a world of naval warfare and maritime trade, where human movement and the projection of power were strictly constrained to the world’s oceans.
Today, however, we live in an aerospace and cyber era. Intercontinental ballistic missiles, long-range strategic bombers,commercial aviation, and satellite constellations do not follow rhumb lines across the Atlantic or Pacific. They travel along great circle routes—the shortest distance between two points on a sphere—which frequently cut straight across the top of the globe. When we view the world through a Mercator lens, we artificially split the northern hemisphere at the top edge of the map, creating an illusion of vast, comforting distance between continents that are actually neighbours.
Seeing Through Richard Edes Harrison’s Eyes
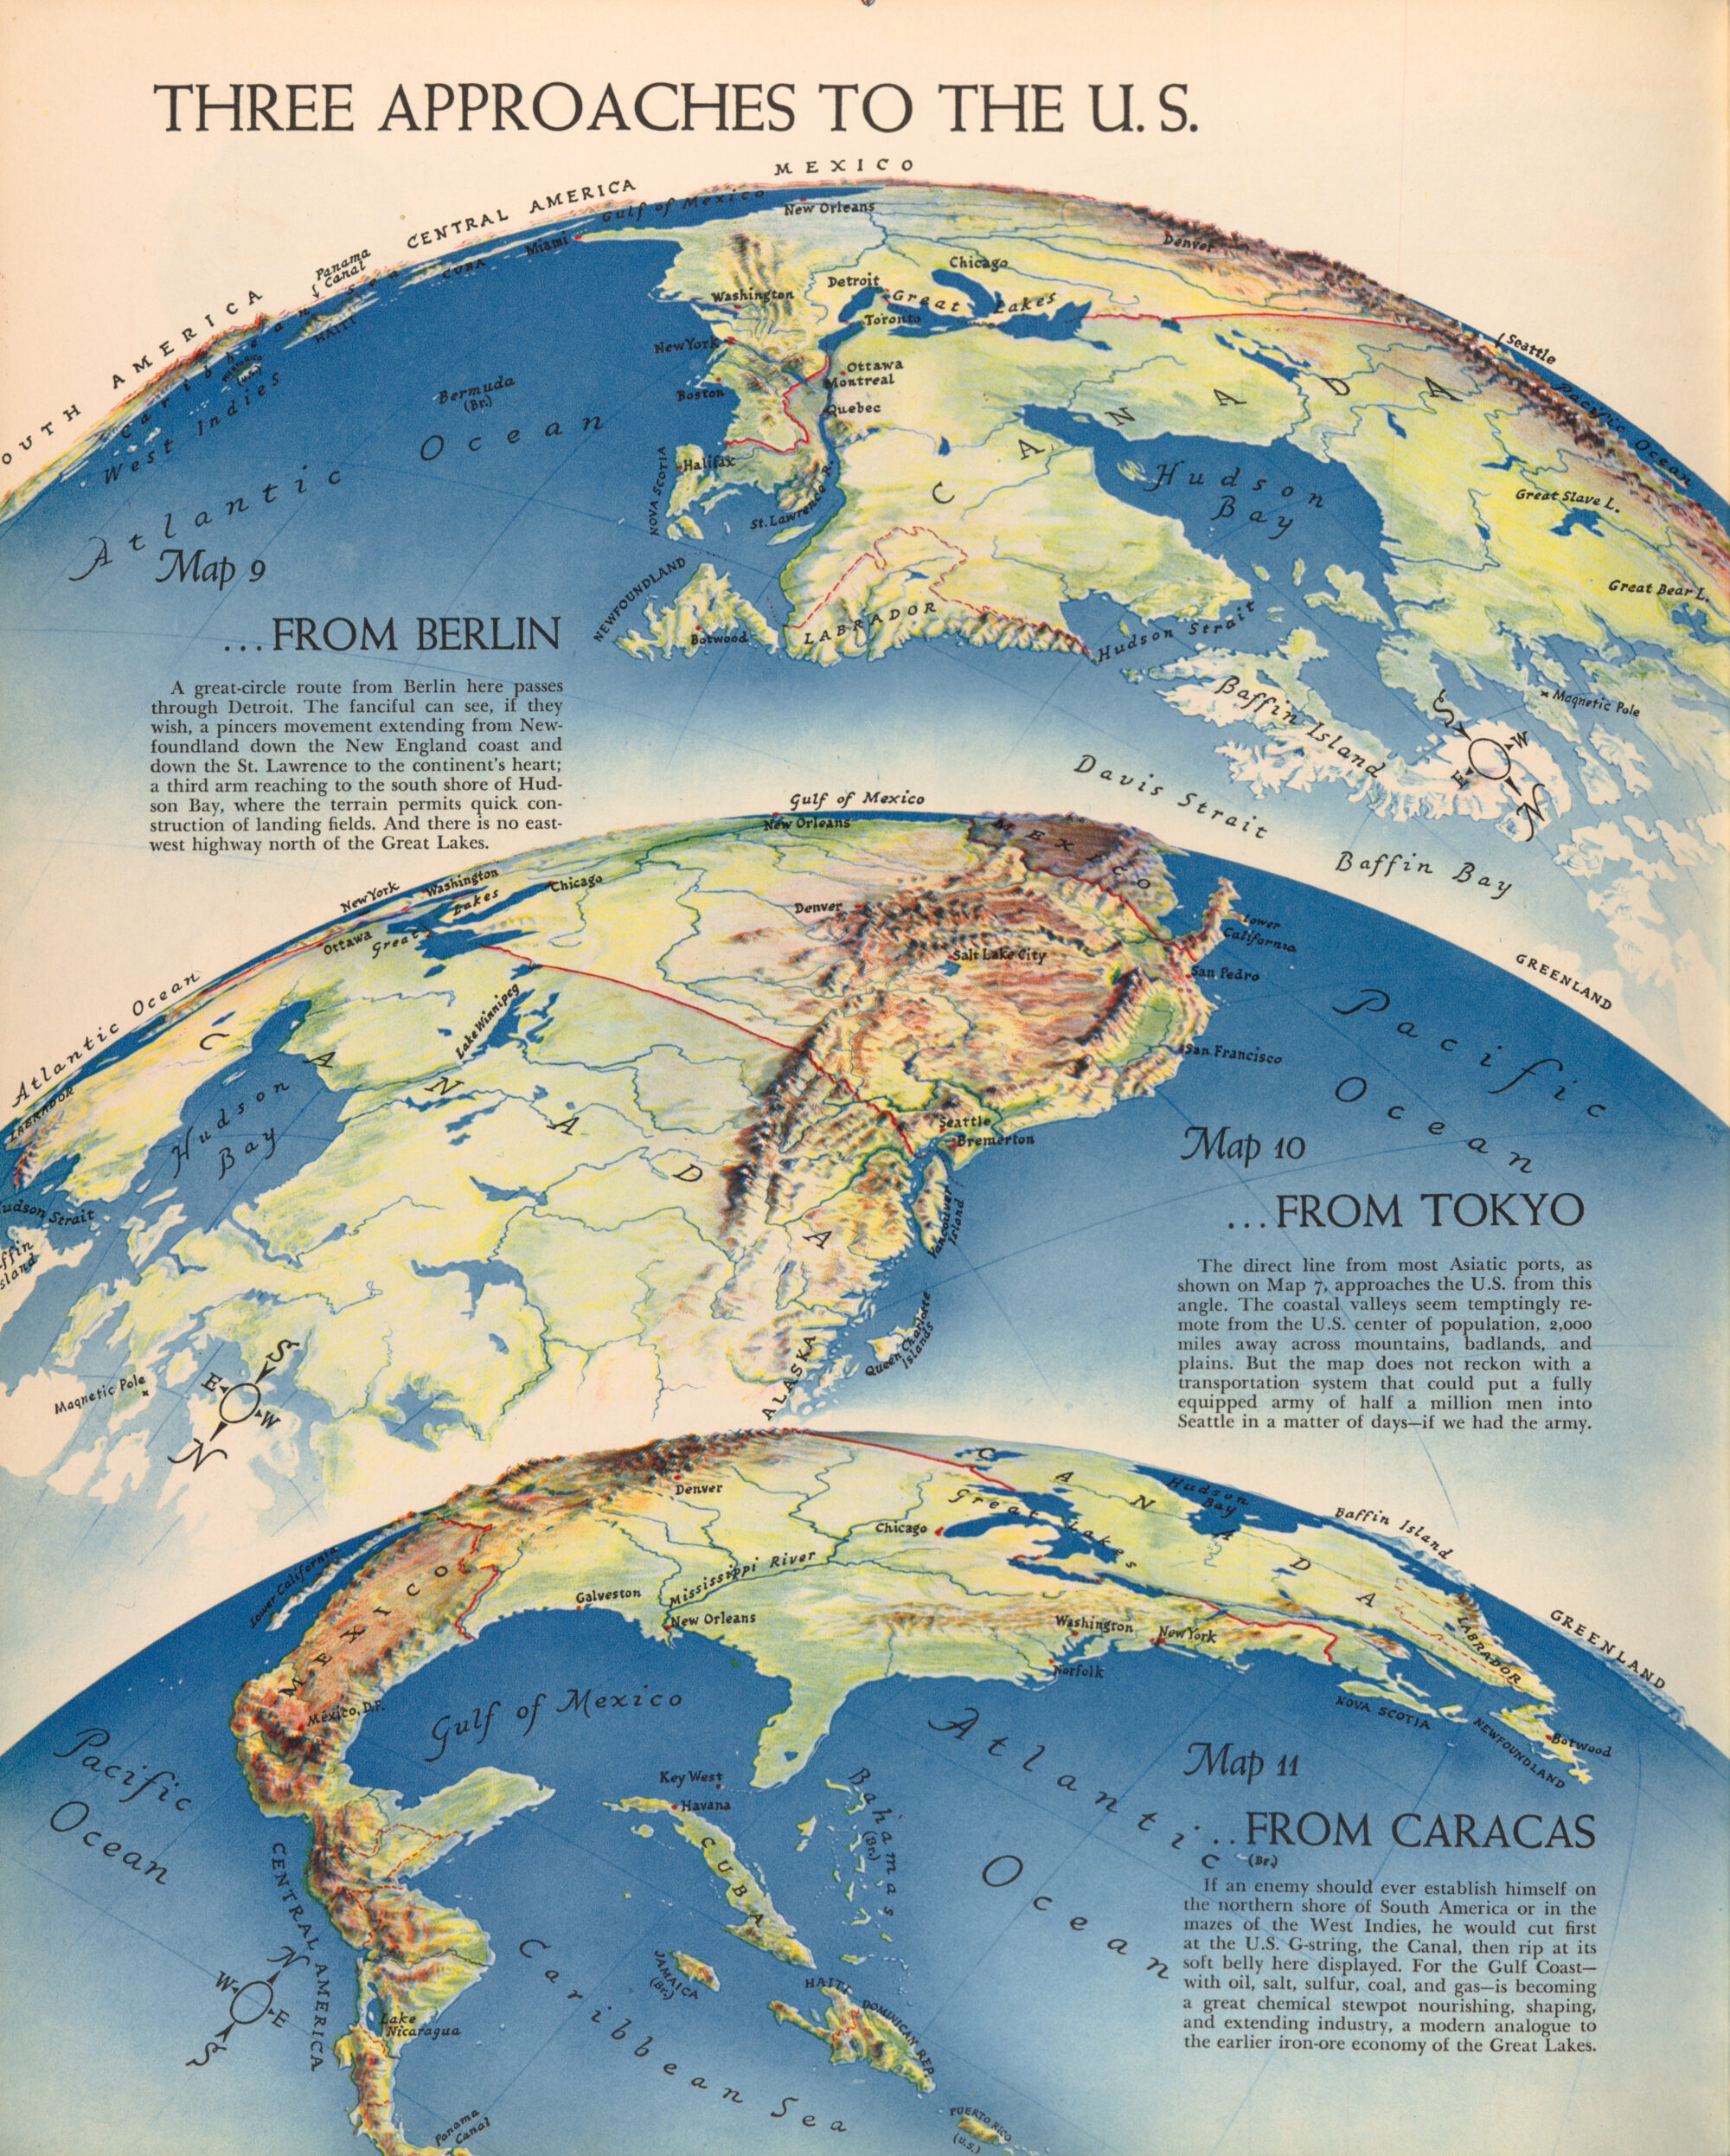
This isn’t a new realization, though it is one we seem to forget during periods of relative peace. During World War II, the American cartographer and illustrator Richard Edes Harrison revolutionised how the public understood global strategy.Working for Fortune magazine, Harrison recognised that standard rectangular wall maps lulled Americans into a false sense of security, making the Atlantic and Pacific oceans look like insurmountable moats.
In his famous September 1940 series, “Three Approaches to the U.S.,” Harrison abandoned the traditional north-up, rectangular frame. Using orthographic and azimuthal perspectives—effectively looking at the globe from high altitudes at oblique and polar angles—he showed the United States from the perspective of potential adversaries across the Arctic, the Atlantic, and the Pacific.
Suddenly, the geography of vulnerability became unmistakably clear. By centering his maps on the North Pole, Harrison demonstrated that the shortest route between the industrial heartlands of North America and Eurasia wasn’t across the wide mid-latitudes, but over the Arctic Circle. He proved that changing the projection doesn’t just change the aesthetics of a map; it fundamentally alters strategic comprehension.
The Virtual Globe’s Missed Opportunity
We actually had a golden opportunity to break free from this flat-earth straitjacket. When virtual globes like Google Earth arrived in the mid-2000s, they liberated cartography from the constraints of 2D projection mathematics altogether. For the first time, anyone with an internet connection could spin a true three-dimensional digital twin of the Earth, tilt the horizon, and intuitively grasp great circle paths and polar proximity without a single line of distortion.

Even desktop web maps eventually introduced 3D globe modes when zoomed all the way out. Yet, in practice, the gravitational pull of the 2D interface won out. Because flat tile-based web mapping (Web Mercator) proved vastly simpler to engineer, overlay data onto, and embed into news articles and dashboards, it became the default visual grammar of the internet. Rather than using the virtual globe to rewire our spatial intuition, we largely defaulted to spinning it with “North” locked straight up, recreating the exact same equatorial bias in three dimensions.
The Tyranny of Geography
Why does this matter so much right now? As Tim Marshall vividly illustrates in his bestselling book, Prisoners of Geography, physical geography remains the single most important—and often overlooked—factor in international affairs.Leaders may come and go, and technologies evolve, but mountains, rivers, oceans, and distances dictate the strategic choices available to nations.
Marshall’s work is packed with examples of how proximity and physical chokepoints drive global conflict:
- The Arctic: Marshall dedicates an entire chapter to the melting ice cap, noting that as the Northwest Passage and Northern Sea Route open up, the Arctic is transforming from an impassable frozen barrier into a contested geopolitical arena. On a Mercator map, the Arctic is stretched into an incomprehensible, infinite white strip at the top of the screen. On a polar azimuthal projection, it is immediately obvious that the Arctic Ocean is a small, enclosed sea surrounded by the United States, Russia, Canada, Norway, and Denmark—a modern-day Mediterranean where military bases and shipping lanes sit right on each other’s doorsteps.
- The Arctic: Marshall dedicates an entire chapter to the melting ice cap, noting that as the Northwest Passage and Northern Sea Route open up, the Arctic is transforming from an impassable frozen barrier into a contested geopolitical arena. On a Mercator map, the Arctic is stretched into an incomprehensible, infinite white strip at the top of the screen. On a polar azimuthal projection, it is immediately obvious that the Arctic Ocean is a small, enclosed sea surrounded by the United States, Russia, Canada, Norway, and Denmark—a modern-day Mediterranean where military bases and shipping lanes sit right on each other’s doorsteps.
- The Indo-Pacific: Even further south, understanding China’s “String of Pearls” strategy or its anxiety over the Strait of Malacca requires seeing the globe as a continuous curved surface rather than a flat grid.
Shifting Our Perspective
In our daily lives, Web Mercator serves us wonderfully when we are zooming in to find a coffee shop in London or navigating a roundabout in Tokyo. At a local scale, preserving local angles and shapes is exactly what we need.
The problem arises when we zoom all the way out and use that exact same projection as our mental model for global affairs. When news outlets use a Mercator basemap to illustrate missile ranges, flight paths, or Arctic territorial claims, they are actively distorting the spatial reality of the story.
As professional Geographers, we have a responsibility to match the projection to the narrative. When the story is about global geopolitics, power projection, and the shrinking distances of the modern world, it’s time to put Mercator away and look down from the poles.